


Table of contents
- console.assert()
- console.clear()
- console.count()
- console.countReset()
- console.debug()
- console.dir()
- console.dirxml()
- console.error()
- console.group() & console.groupEnd()
- console.groupCollapsed()
- console.info()
- console.log()
- console.table()
- console.time() & console.timeEnd()
- console.timeLog()
- console.trace()
- console.warn()
- Non-Standard Methods
- console.profile() & console.profileEnd()
- console.timeStamp()
- Conclusion
- Sources:
When we first learn to code in JavaScript we quickly learn the console method console.log() and then for many stop there because it works in the vast majority of situations. But, did you know that there are potentially much better methods you could be using?
Today, in this blog post we are going to take a look at all of the 19 standard console methods as well as the 3 non-standard ones. Let’s get started.
console.assert()
Sometimes we want to only put information in the console when a condition is false and this is the perfect use case of console.assert(). We pass in a condition and if it evaluates to false then we print the supplied message to the console. If the condition evaluates to true then nothing happens.
const errorMsg = 'the # is not even';
for (let number = 2; number <= 5; number += 1) {
    console.log('the # is ' + number);
    console.assert(number % 2 === 0, {number: number, errorMsg: errorMsg});
    // or, using ES2015 object property shorthand:
    // console.assert(number % 2 === 0, {number, errorMsg});
}
// output:
// the # is 2
// the # is 3
// Assertion failed: {number: 3, errorMsg: "the # is not even"}
// the # is 4
// the # is 5
// Assertion failed: {number: 5, errorMsg: "the # is not even"}
console.clear()
I’m sure we’ve all been there with a console that gets populated full of messages either from our logs or the logs of a framework or package we’re using. In which case, calling console.clear() can help us by clearing the entire console.
console.count()
Want to check how many times a piece of code is running? Or, how often a function is being called? Then console.count() could be for you. With this console method, we can print the number of times that instance of console.count() has been called. We can even provide an optional label to help us identify it in the console.
let user = "";

function greet() {
  console.count(['Greeting']);
  return "hi " + user;
}

user = "bob";
greet();
user = "alice";
greet();
greet();

// Console would look like: ⬇
// Greeting: 1
// Greeting: 2
// Greeting: 3
console.countReset()
The natural pairing for console.count(). console.countReset() allows us to reset the current value of console.count() back to 0. If a label is provided then it will reset that label back to 0 otherwise it will reset the default counter.
let user = "";

function greet() {
  console.count(['Greeting']);
  return "hi " + user;
}

user = "bob";
greet();
user = "alice";
greet();
greet();
console.countReset(['Greeting']);

// Console would look like: ⬇
// Greeting: 1
// Greeting: 2
// Greeting: 3
// Greeting: 0
console.debug()
From a visual perspective console.debug() is identical to the traditional console.log() but they differ in their implementation. console.debug() will only be shown in the console if the user has configured their console to display debug outputs. Otherwise, the message will be hidden.
console.dir()
One of the best uses of the console is to investigate data stored within an object and console.dir() is designed for just that. If you pass an object to console.dir() it will print it out to the console and allow you to expand/collapse the various child properties of the object to explore it.
const person = {
  firstName: "John",
  lastName: "Doe",
  age: 50,
  eyeColor: "blue",
    pets: {
        count: 1,
    },
}

console.dir(person);

// Object { firstName: "John", lastName: "Doe", age: 50, eyeColor: "blue", pets: {…} }
    // age: 50
    // eyeColor: "blue"
    // firstName: "John"
    // lastName: "Doe"
    // > pets: Object { count: 1 }
    // > <prototype>: Object { … }
console.dirxml()
Similar to console.dir() but for HTML/XML elements. This method will let you explore an interactive tree of elements decedent of the element passed to console.dirxml(). If the element passed to the method can’t be displayed as an element for some reason then it will instead use the JavaScript object view.
// If you had this markup on the page ⬇

// <div class="body">
//   <h1>Title</h1>
//   <p>Some text here</p>
// </div>

console.dirxml(document.querySelector(".body"));

// It would log out like this ⬇

// <div class="body">
//     <h1>Title</h1>
//     <p>Some text here</p>
// </div>
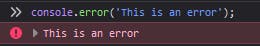
console.error()
Sometimes things go wrong and that’s okay. But, we need to know about them so putting errors in the console is a great way of looking at them. But, instead of using console.log() which makes it look like every other message in the console, use console.error() which makes the message stand out from the others to grab your attention.
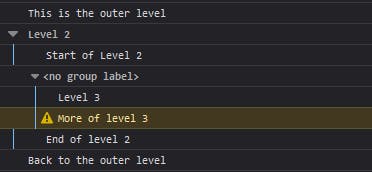
console.group() & console.groupEnd()
Got a bunch of similar logs to the console and want to keep them together for easier reading? Consider using console.group(), this method allows us to create inline groups in the Web console log. We can also add multiple levels within the group by calling console.group() again within itself multiple times. This behaviour will continue until we call console.groupEnd() to end the grouping.
Take this group of logs to the console:
console.log("This is the outer level");
console.group('Level 2');
console.log("Start of Level 2");
console.group();
console.log("Level 3");
console.warn("More of level 3");
console.groupEnd();
console.log("End of level 2");
console.groupEnd('Level 2');
console.log("Back to the outer level");
It would be displayed in the browser like so:
console.groupCollapsed()
console.groupCollapsed() has the same behaviour as console.group() but instead of being added to the console in the expanded state like console.group() does. With console.groupCollapsed() the group is added to the console in a collapsed state and the user needs to use the disclosure button next to it to expand it.
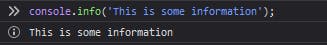
console.info()
conosle.info() is a way of outputting information to the Web console. (In Firefox a small “i” is displayed next to the output to indicate it is information.)
console.info('This is some information');
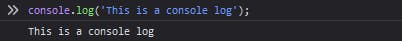
console.log()
Ah, the good old console.log() method, it’s often the first method that we learn when working with the console and it allows us to add data to the console in the form of strings or any one or more JavaScript objects.
console.log('This is a console log');
When you print out an object or DOM element with console console.log()it appears similar to the output we get using console.dir() from earlier. However, there is a difference with console.log() we get the element printed in an HTML-like tree. But, with console.dir() we get a JSON-like tree. console.log() gives special treatment to DOM elements whereas console.dir() doesn’t.
console.table()
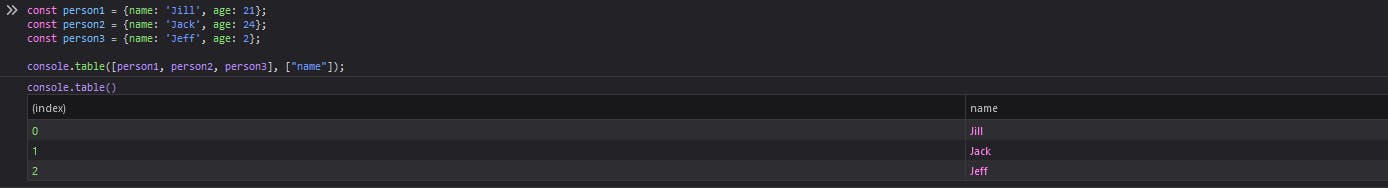
Using the console.table() method displays tabular data as a table for the user to explore. You must provide it with an array or object for the one mandatory argument data.
If you are displaying an array of objects, you can also use the optional argument columns to specify which columns you would like to display in the output. By default, if we don’t pass any arguments to columns then all of the data is displayed.
Here is an example:
const person1 = {name: 'Jill', age: 21};
const person2 = {name: 'Jack', age: 24};
const person3 = {name: 'Jeff', age: 2};

console.table([person1, person2, person3], ["name"]);
console.time() & console.timeEnd()
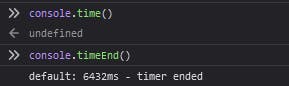
You can use a combination of console.time() and console.timeEnd() to start and stop a timer in the browser. Once the timer is stopped using console.timeEnd() the browser will output the time in milliseconds that has elapsed since the time was started.
You can optionally pass a label argument to the methods to start and stop a specific timer using the given label. If no label is given then the default timer is started and stopped.
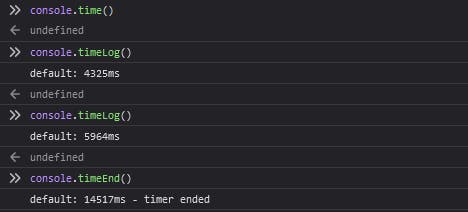
console.timeLog()
If you would like to check in on an active timer that has been started using console.time() then you can use console.timeLog(), this will print out the current time of the timer to the console. You can only call this method when there is an active running timer that is either the default or with the label passed.
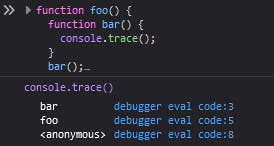
console.trace()
By calling the method console.trace() we can output the stack trace that was used to call the method.
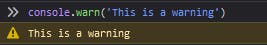
console.warn()
Similar to console.error() that we looked at earlier, console.warn() is used to output a styled message to the console that indicates a warning to the user. You can pass it a string or a list of objects to print to the console.
In Chrome and Firefox, warnings printed via console.warn() have a small exclamation point next to them in the console.
Non-Standard Methods
In this section are all of the console methods that are considered by MDN.
💡 To be non-standard means they are not on a standards track. You should not use these methods in production as they will not work for every user and there may be large incompatibilities between implementations that could change in the future.
console.profile() & console.profileEnd()
By calling console.profile() you start recording a performance profile (e.g. the Firefox performance tool). As with a lot of the methods we looked at with this type of behaviour we can pass an optional argument to name the profile.
If we name the profile being recorded we can stop just that profile using console.profileEnd() by providing the name if multiple are being recorded.
console.timeStamp()
If we call console.timeStamp() we can add a marker to the browsers Performance or Waterfall tool. This lets us correlate a point in our code with other events recorded in the performance timeline-like layout and content paint events.
You can also pass a label (optional) to label the timestamp which will be shown alongside the marker.
Conclusion
So, we just covered all of the console methods currently supported and in use today. I hope that’s given you some ideas and knowledge for the next time you need to do some debugging and console.log() isn’t cutting it for you.
Let me know your new favourite console method in the comments below.
I hope you found this article helpful. If you did please consider sharing it with others so they can find it helpful too. If you would like to see more content like this please consider checking out my Twitter profile where I share Web Development content every day or my YouTube channel where I create Web Development themed videos.
Thank you for reading. 😊